Tracking & Visualization
Experiment Tracking
Each time an experiment is run, Luminide automatically saves a snapshot of all of the inputs and outputs. You can see a list of all of the experiments run by selecting:
Menu: Luminide > Experiment Tracking
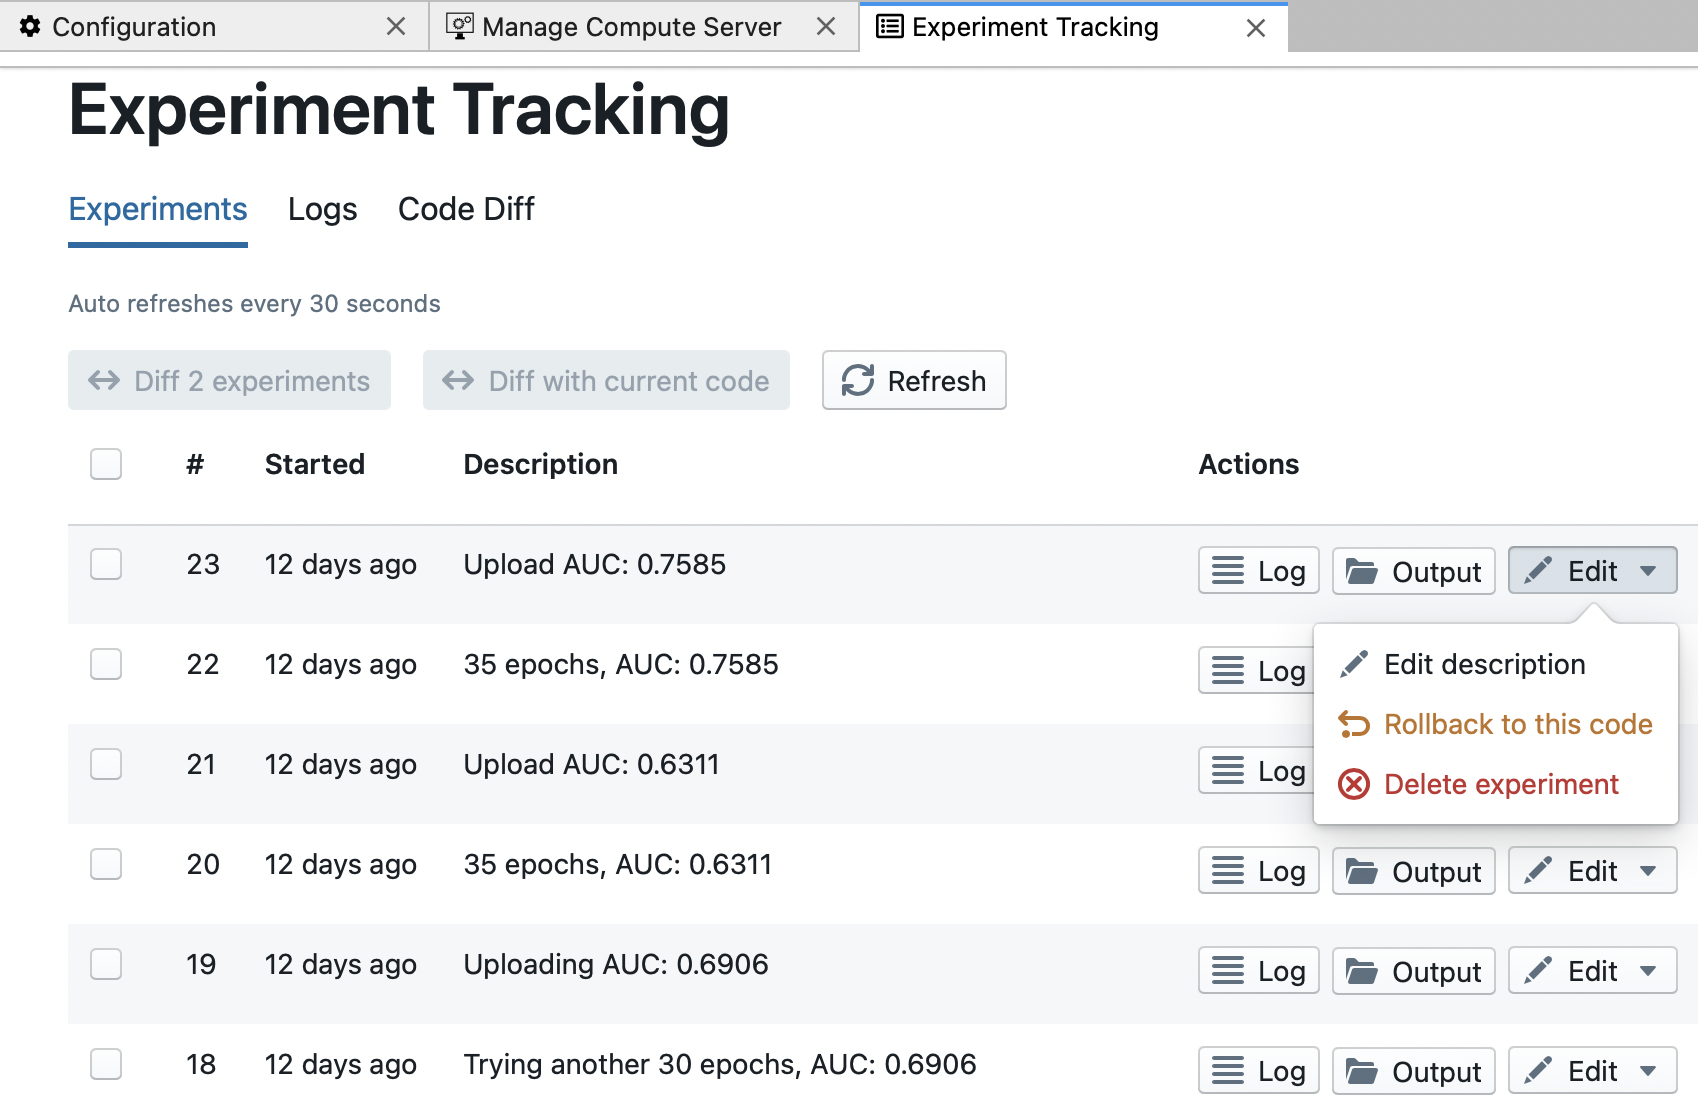
Each experiment is listed with its description and actions to jump to the corresponding log file, jump to the corresponding output directory (in the code browser in the left-hand sidebar), or do one of the following:
Edit Description: Add or modify the experiment descriptionRollback to this code: Rollback to a previous version of the code (to explore different paths forward)Delete experiment: Clean up experiments not worth saving (e.g. syntax errors)
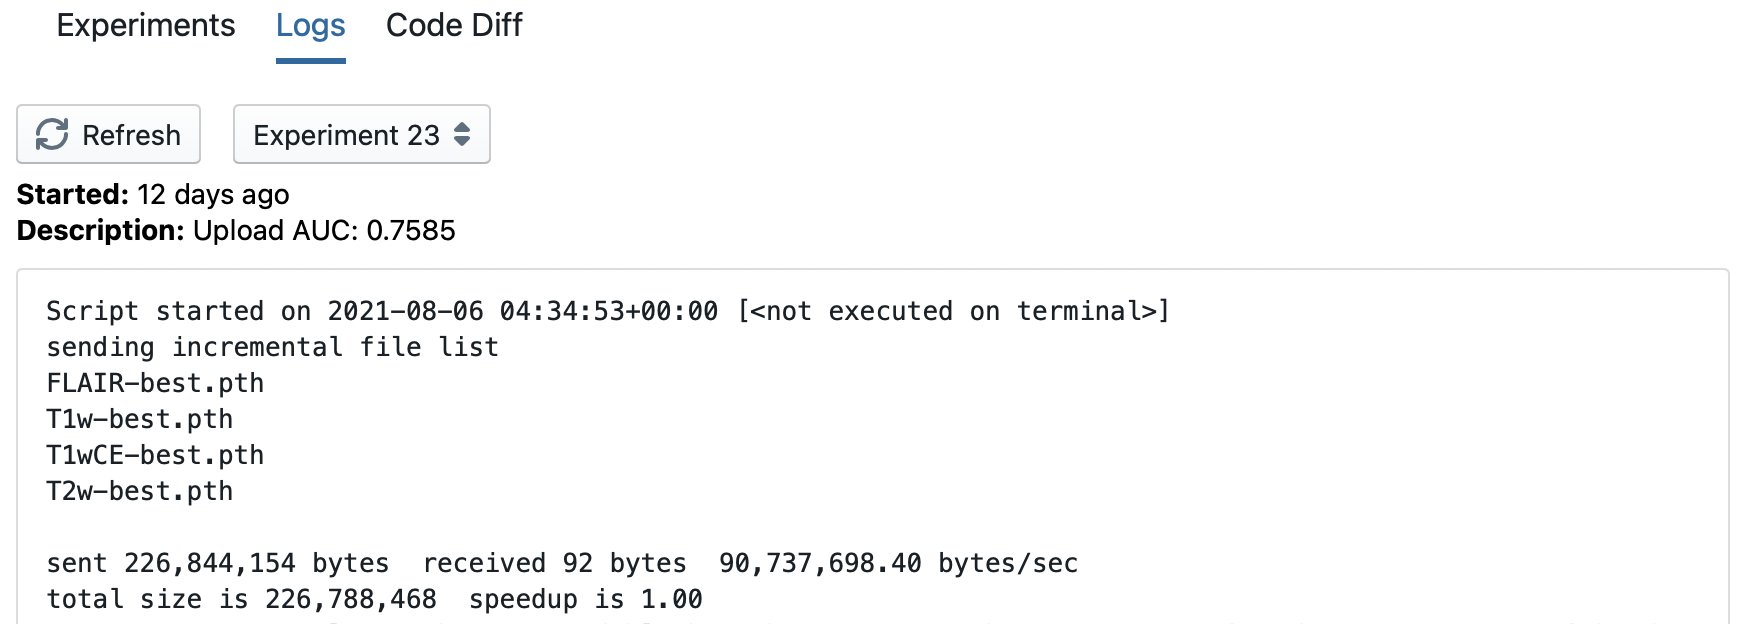
You can also browse logs files from different experiments in the Logs tab:
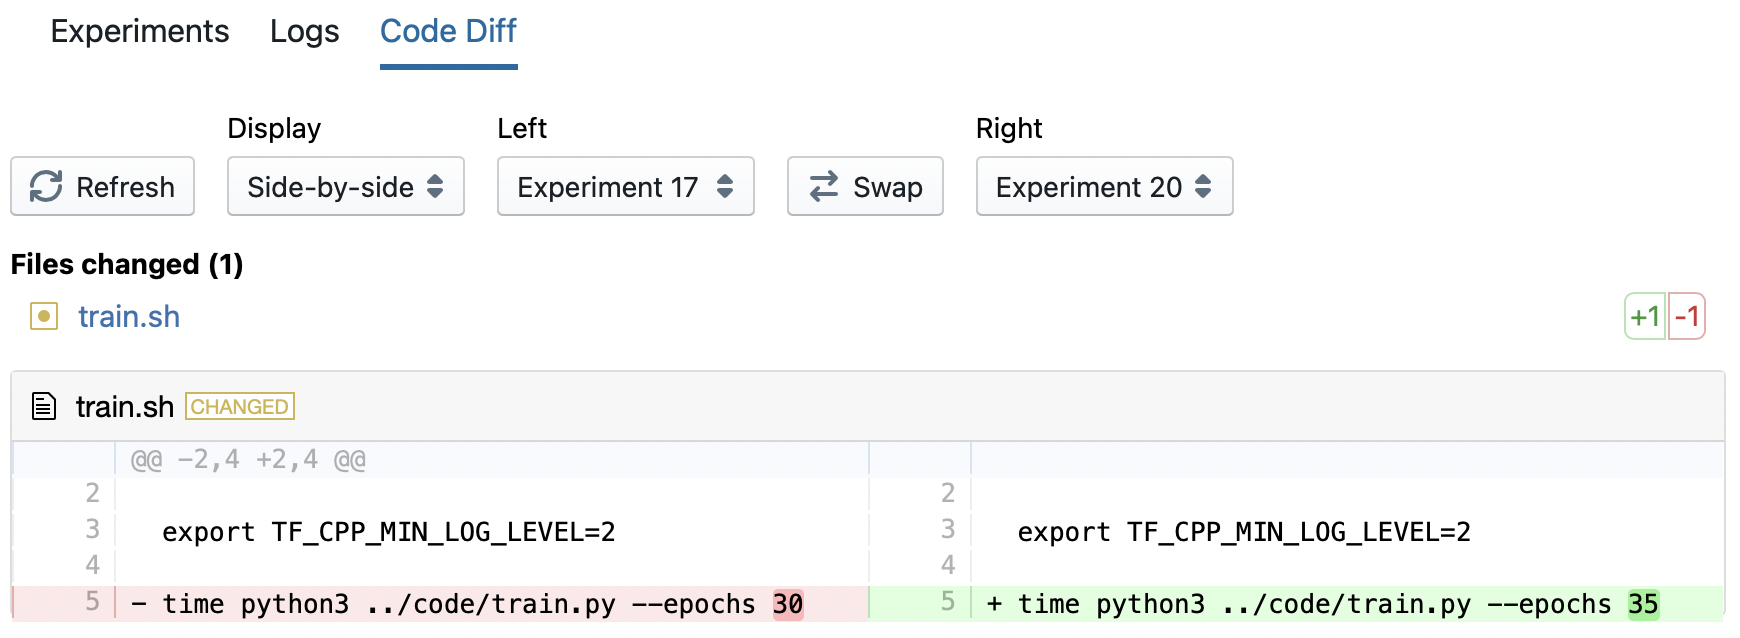
And compare the inputs from two different experiments using the Code Diff tab:
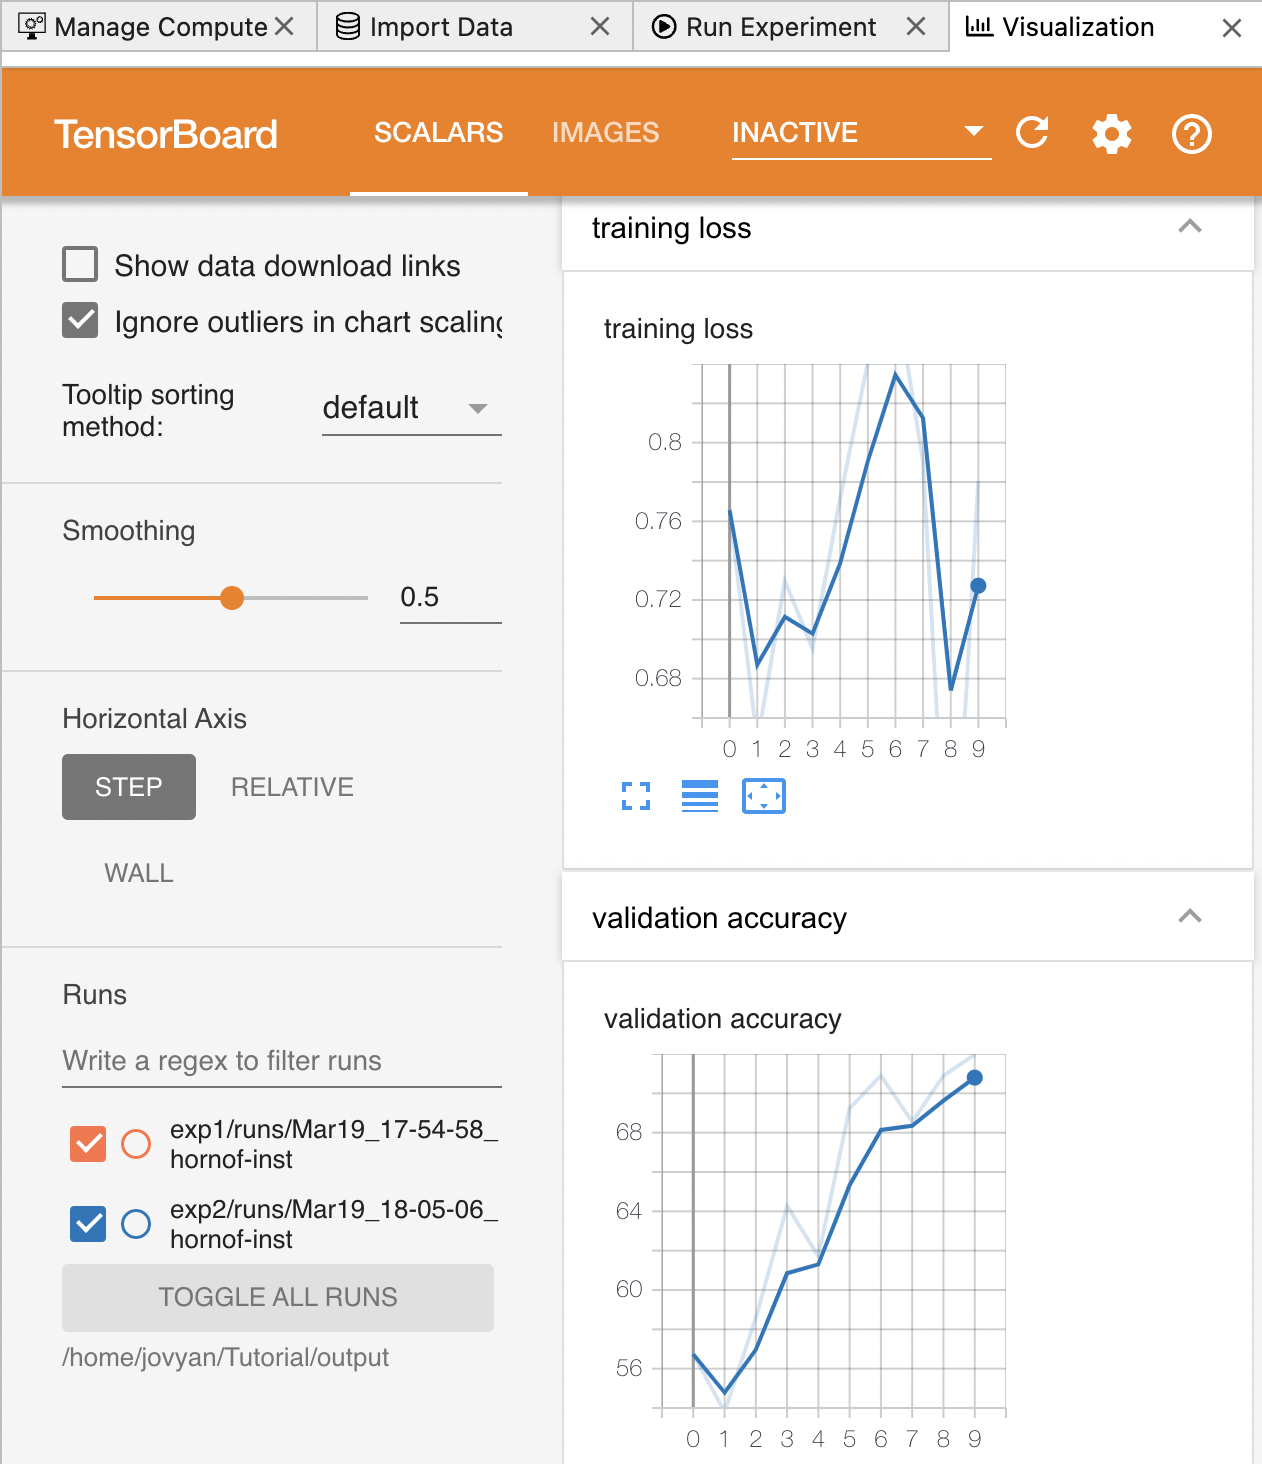
Experiment Visualization
To enable monitoring with TensorBoard, follow the TensorBoard documentation. Add the following lines to the training code for minimal functionality:
from torch.utils.tensorboard import SummaryWriter

writer = SummaryWriter()

    # inside the training loop
    writer.add_scalar('Validation loss', val_loss, epoch)

writer.close()
Results can be viewed with Tensor Board by selecting this option from the menu:
Menu: Luminide > Experiment Visualization
Here you can see how the training loss changes over time.