Hyperparameter Tuning
With Luminide Templates
Luminide includes built-in Bayesian hyperparameter tuning. If you use Luminde templates, no code changes are required. Simply choose:
Menu: Luminide > Run Experiment
and navigate to the Sweep tab. Here you can configure your hyperparameter tuning:
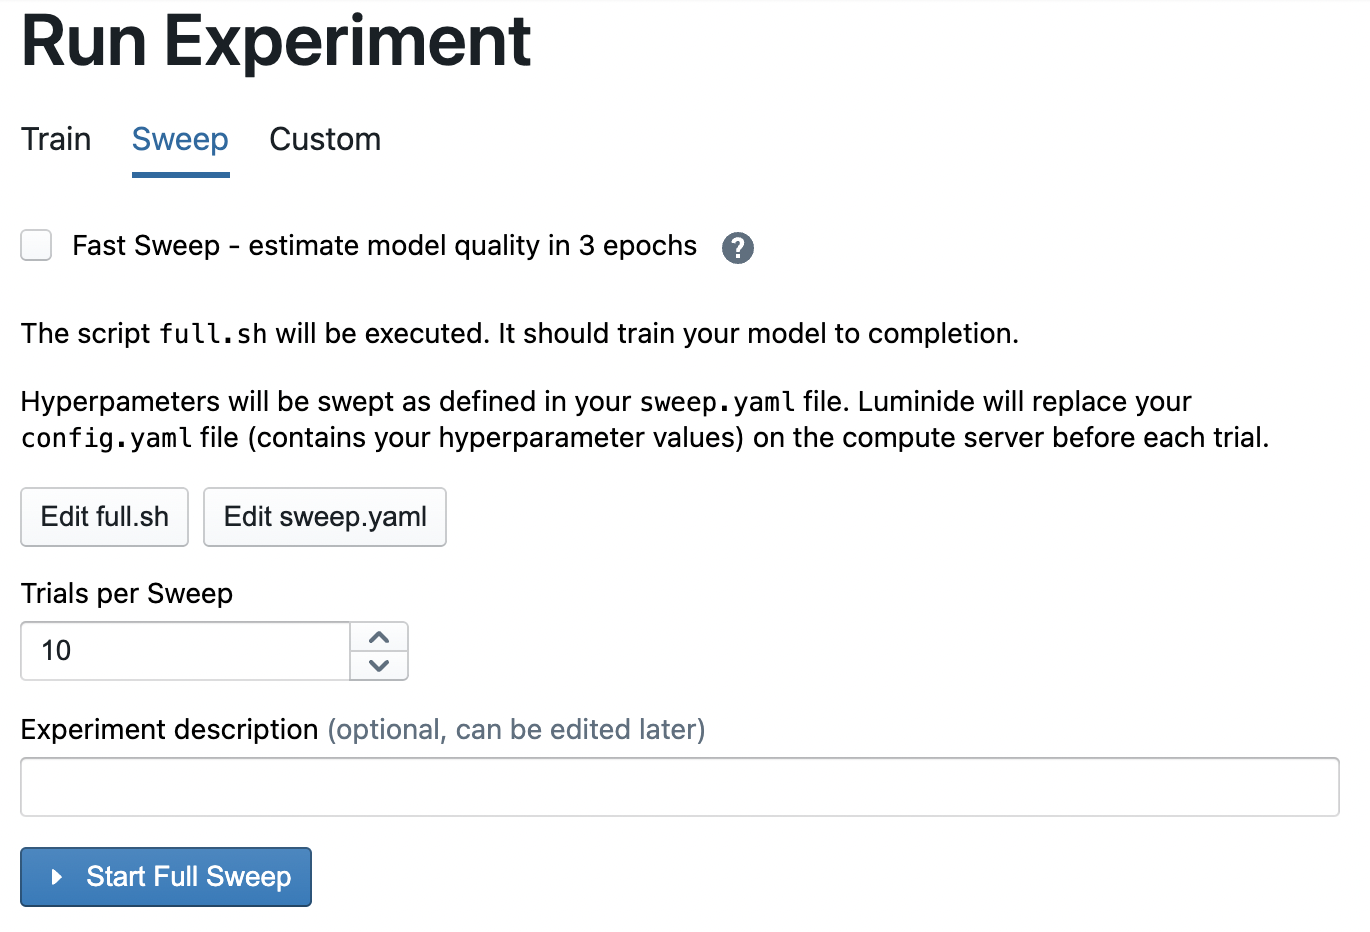
full.sh: This is the same file that is used to do single training runs. Modify this file, e.g. to change the number of epochs in each run.
Trials per Sweep: This value controls the number of runs in a sweep.
sweep.yaml
The ranges/values for hyperparameters should be specified in a file called sweep.yaml:
parameters:
  param1:
    values: <list of comma separated values>

  param2:
    distribution: <distribution name>
    min: <minimum value>
    max: <maximum value>l
    q: <optional step value>
Use “values” for categorical hyperparameters and “distribution” for others. The following distributions are supported:
uniform: Continuous uniform distribution
log_uniform: Continuous log-uniform distribution
q_uniform: Quantized uniform distribution. A step value named “q” must be specified in addition to min and max.
For real valued distributions, specify the min and max values with a decimal point. Otherwise integer values will be returned.
Example sweep.yaml file:
parameters:

  arch:   # categorical
    values: ['resnet18', 'resnet50']

  lr:    # real-valued log-uniform
    distribution: log_uniform
    min: 0.0001
    max: 0.1

  batch_size:    # integer-valued quantized uniform
    distribution: q_uniform
    min: 8
    max: 32
    q: 8
Fault Tolerance
Luminide records a sweep’s progress in the file full-sweep.pkl. Each time a trial sweep is completed, Luminide updates this file with the results of the trial, if the trial is the best so far, etc. This allows users to resume a sweep that was interrupted, e.g. from a less expensive spot compute server getting preempted. This feature also allows users increase the number of trials, even after a sweep has completed.
Therefore, if a full-sweep.pkl file exists when starting a sweep, Luminide will prompt you to resume the previous sweep:
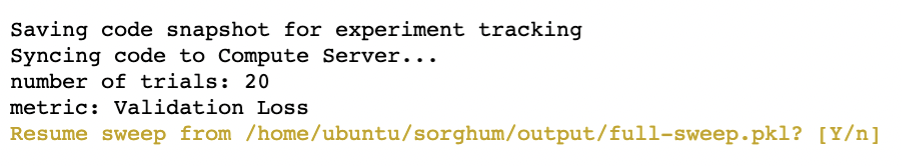
The default is to resume. If you do want to start a new sweep, simply type n.
Instrumenting Your Own Code
In addition to using Luminide Templates, you can also perform hyperparameter tuning on code written from scratch or imported from an existing repo. In this case, however, you will need to make minor modifications to your code.
To read the config.yaml file, use the config.py file that’s provided in this this example repo. Then add the following lines to your code to create a dictionary object initialized with its keys and values.
from config import Config

conf = Config()
# now use “conf” to read values of hyperparameters
# e.g. conf[‘weight_decay’]
Also, Luminide sweeps expect the training code to produce a CSV file called history.csv that contains two columns named “epoch” and “epoch_val_loss”. The column named “epoch_val_loss” should contain validation error values obtained after every epoch of training, e.g.:
epoch, epoch_val_loss
0, 0.5789984
1, 0.4998457
…
This file is used by the Bayesian optimizer to determine the set of hyperparameters to use in its next trial.
Run a Sweep
Once you have configured your hyperparameter tuning sweep, launch it with the Start Full Sweep button. This will open an output terminal and start running the first trial.
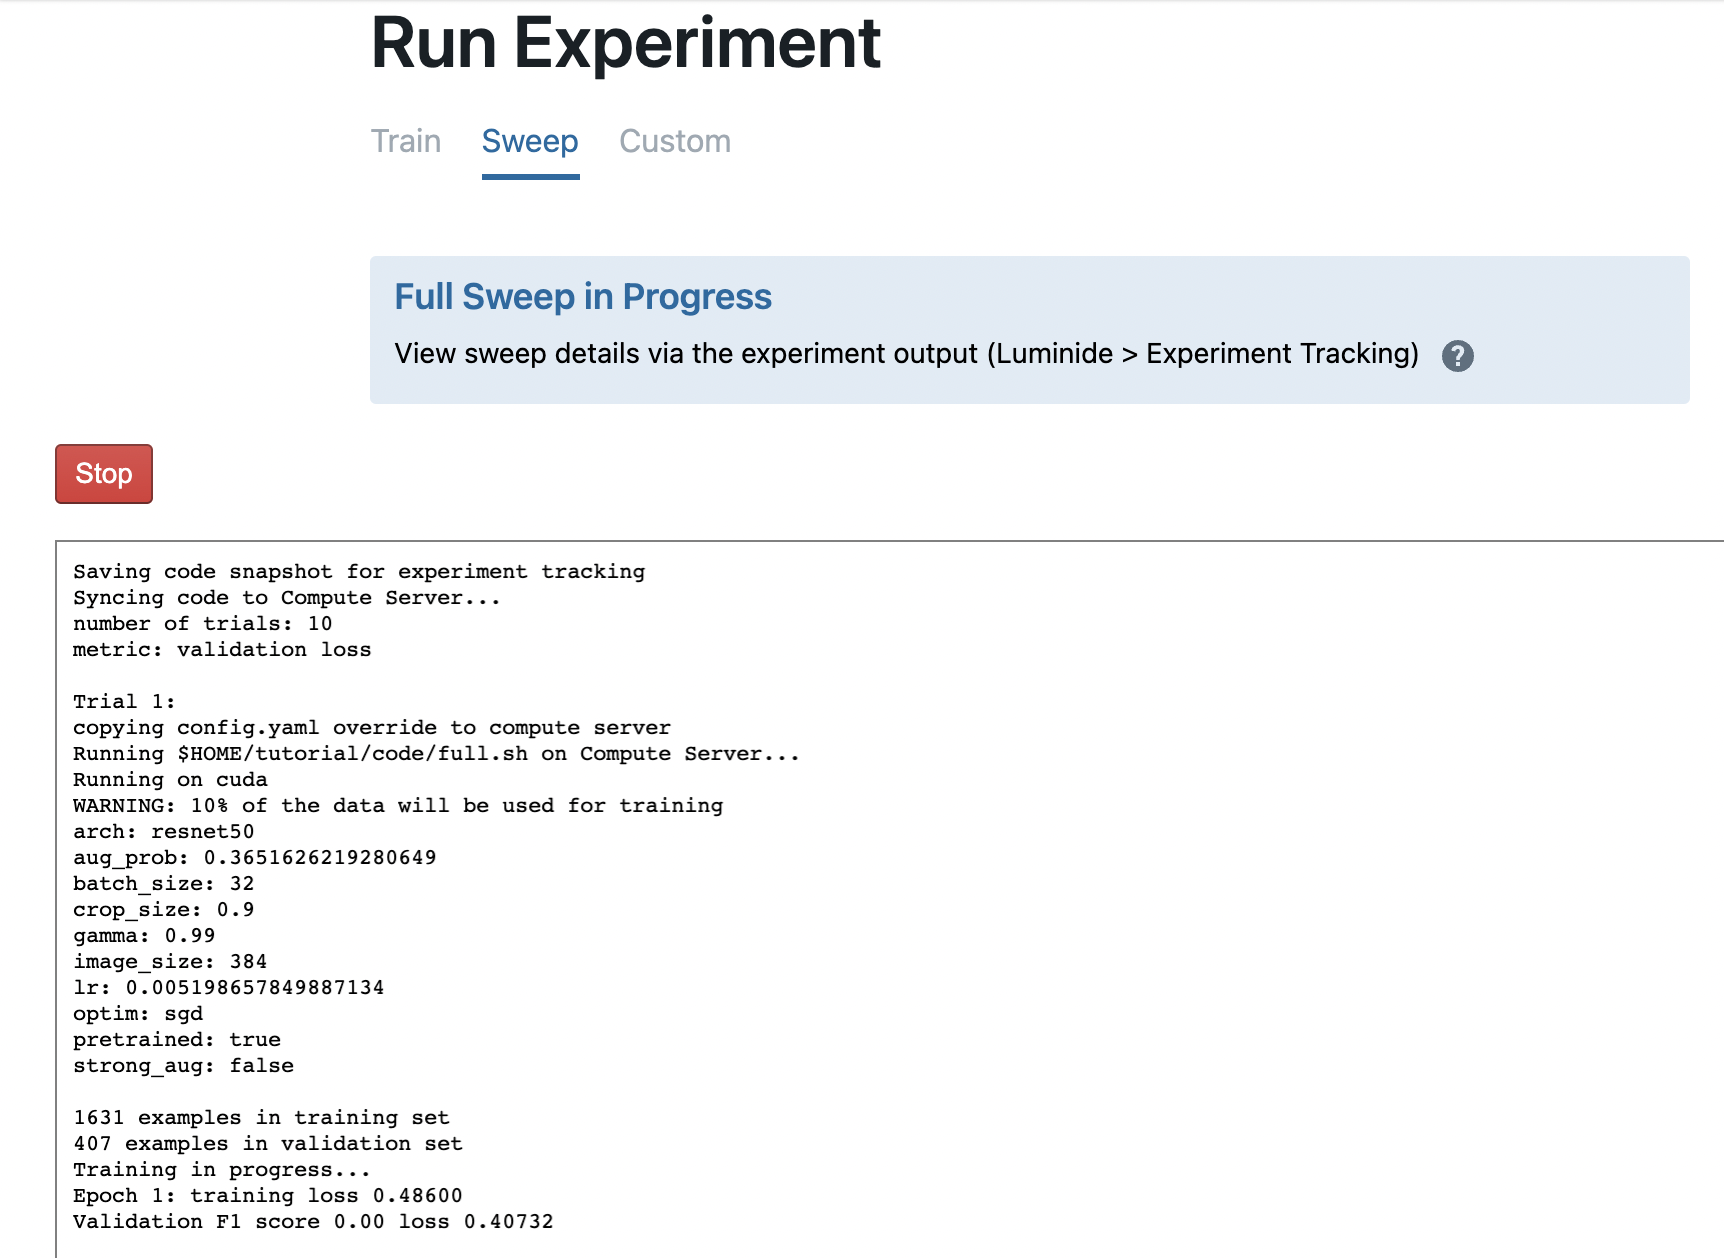
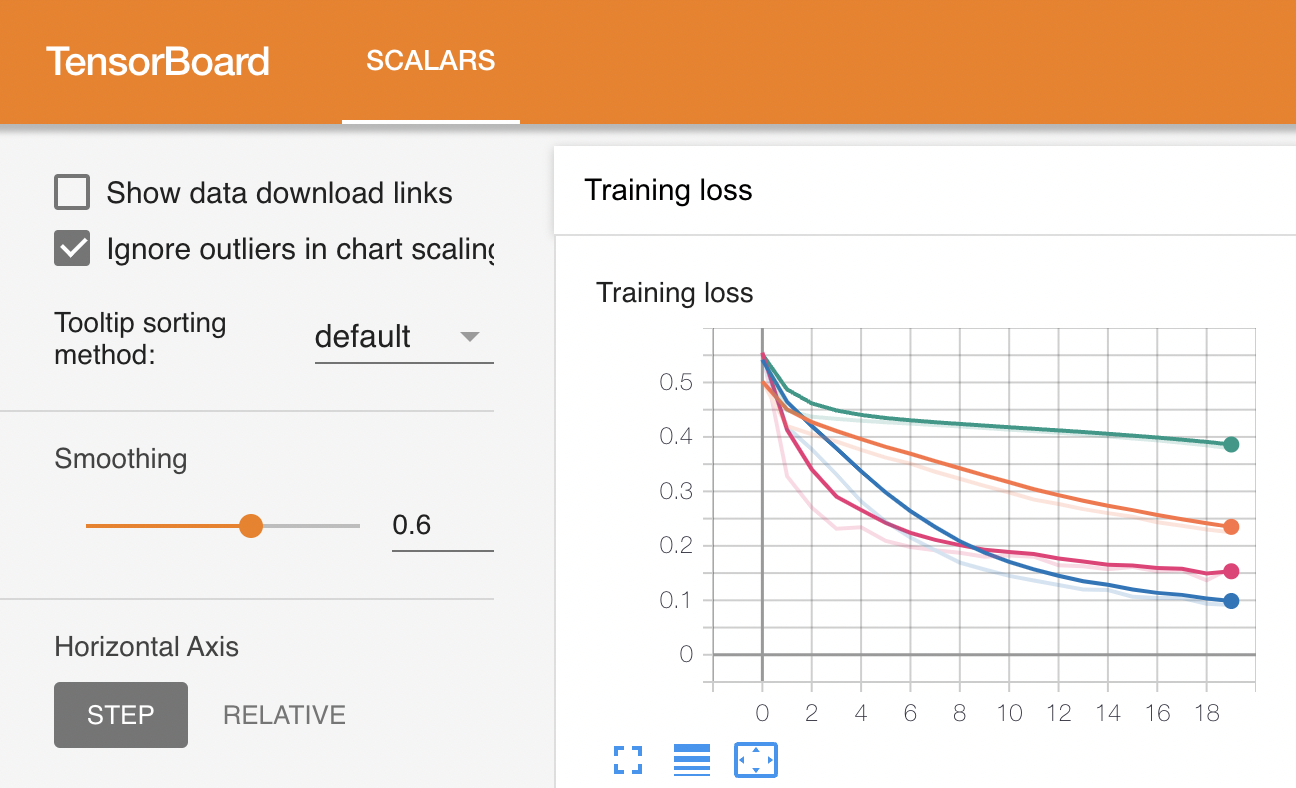
You can track sweeps in progress by using Experiment Tracking or with Experiment Visualization. For example, here’s what a sweep in progress looks like:
When a sweep is completed, the following files are generated in the output directory.
config-tuned.yaml: This file contains the hyperparameter values in the same format as your config.yaml, updated after each “best trial”. This makes it easy to reuse the best results.
sweep_results_raw.csv: This spreadsheet contains all of the hyperparameter values used for each trial, which can give insights into the tuning process.
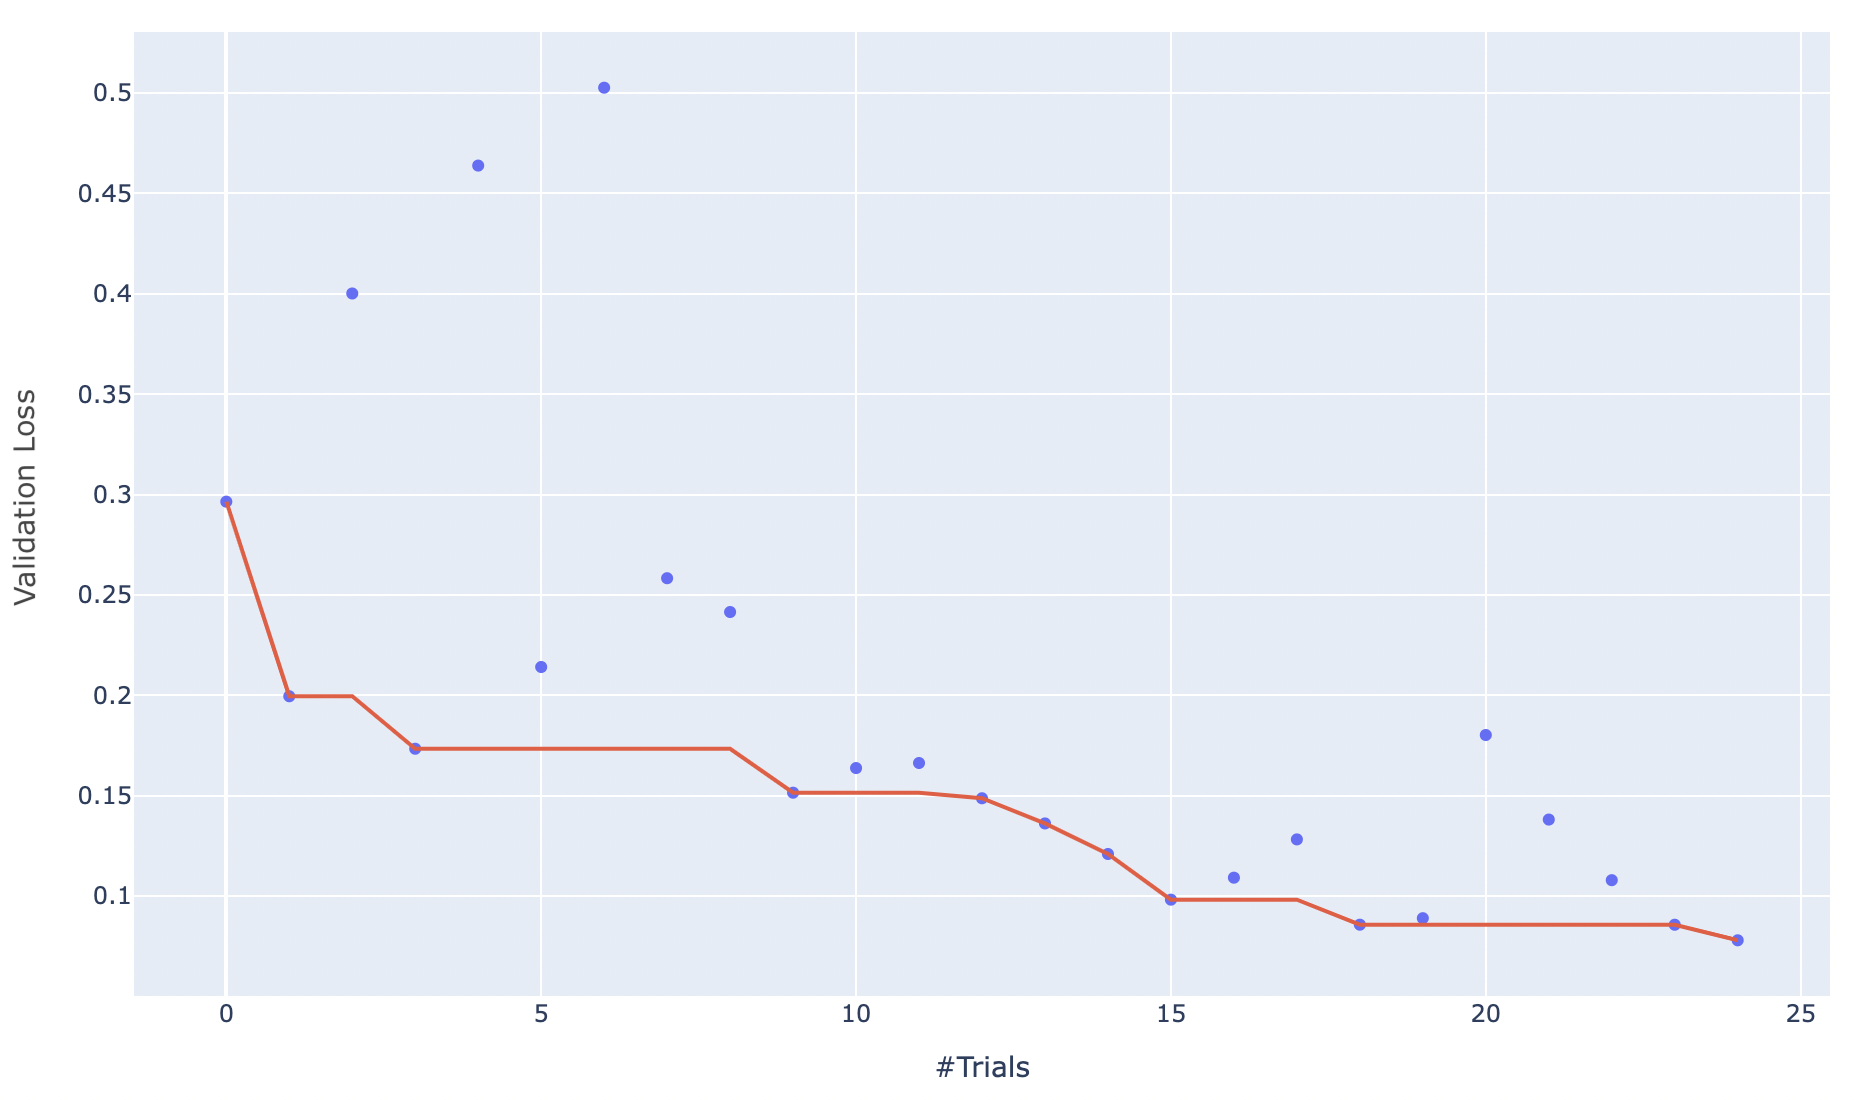
sweep_results_chart.png: This graph displays the validation loss for each trial, and tracks the “best trial”.