Python & PyTorch
Check Python Syntax
Luminide allows you to quickly check for syntax errors in the Python code on the IDE server before copying and executing it on the compute server:
Menu: Luminide > Check Python Syntax
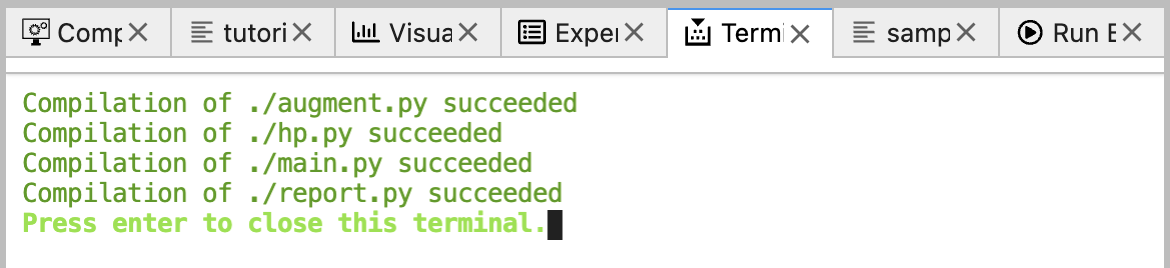
Any syntax errors will be displayed. Error free files will report succeeded.
PyTorch Profiler
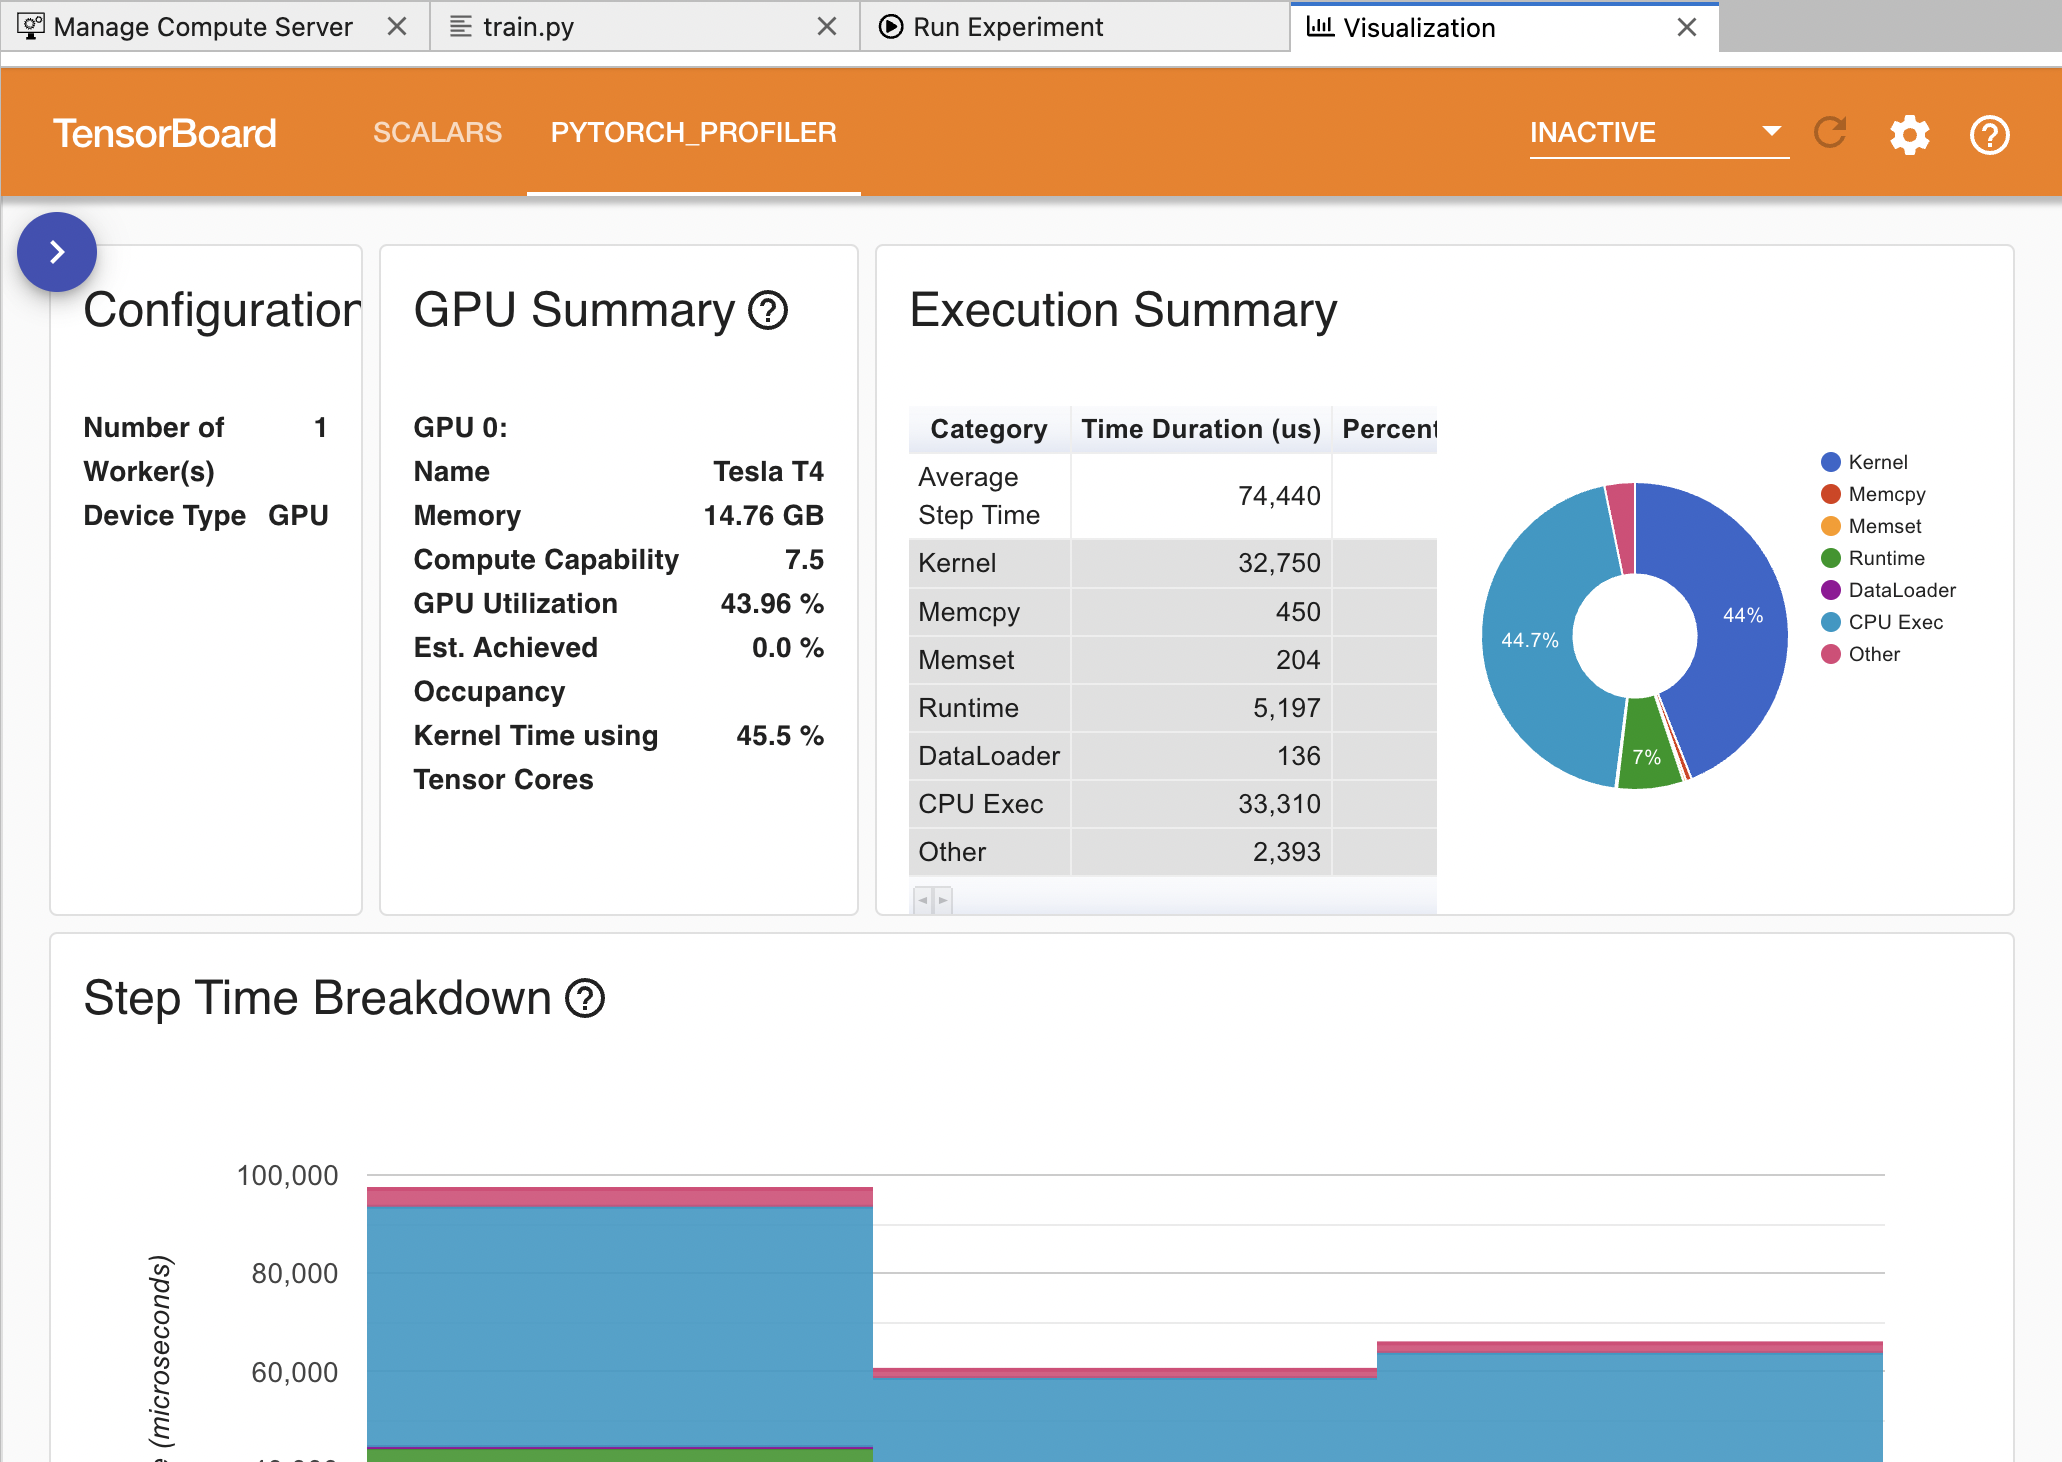
The PyTorch Profiler records the CPU side operations as well as the CUDA kernel launches on the GPU side. The profiler can visualize this information in TensorBoard and provide analysis of the performance bottlenecks.
To use the PyTorch Profiler, update your code to call torch.profiler.profile and prof.step as described here.
Then select the PyTorch_Profiler tab in TensorBoard:
Menu: Luminide > Experiment Visualization
Note: A known bug in PyTorch 1.11 may cause a segfault (signal 11). Workarounds include using PyTorch 1.09 or setting torch.profiler.profile parameter with_stack=False. See PyTorch bug report for more details).